Finance
Surviving the Market Storm: Nifty and Bank Nifty Technical Analysis Explained !

In the realm of financial markets, the recent shifts in sentiment and price dynamics have sparked significant interest, particularly in India’s Nifty 50 and Bank Nifty indices. As of March 19, 2024, both indices have experienced a noticeable downturn, signaling a transition towards bearish sentiment. This article provides an in-depth analysis of the technical aspects of the Nifty’s recent performance, offering insights into key indicators, potential trajectories, and implications for traders and investors.
Bearish Breakdown: Unraveling Nifty’s Decline
March 19, 2024, witnessed a substantial decline in the Nifty 50, as bearish forces seized control of the market. The index decisively breached critical support levels, notably closing below the crucial mark of 21,860, with losses exceeding one percent. This downward spiral can be attributed to various factors, including valuation concerns in the domestic market and cautious anticipation ahead of the US Federal Open Market Committee (FOMC) meeting.
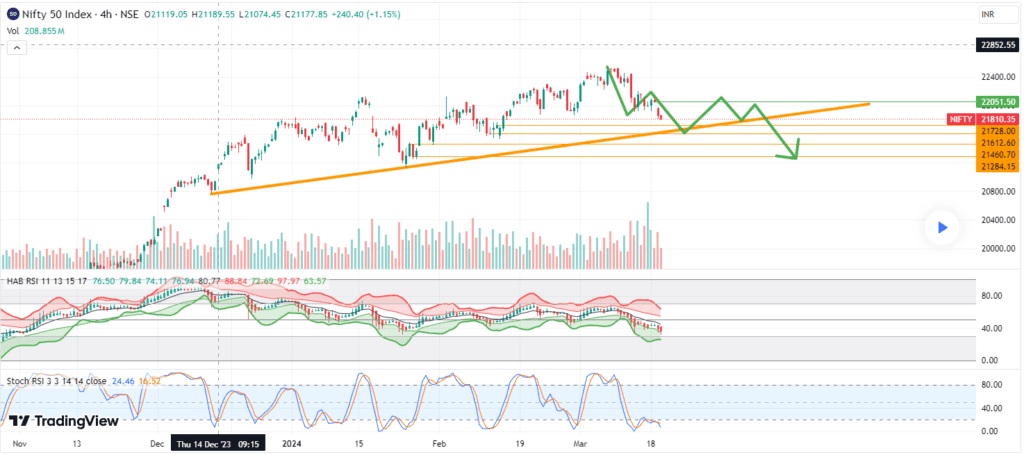
The breakdown of key technical formations further emphasizes the prevailing bearish sentiment. The Nifty 50 shattered the pattern of higher highs and higher lows by plummeting below 21,860, alongside breaching the upward sloping support trendline. Additionally, the index dipped below the 50-day Exponential Moving Average (EMA), hinting at a potential reversal in trend direction.
Key Levels and Potential Targets
Given the prevailing market nervousness, the Nifty 50 is poised for further downside in the days ahead. Immediate support levels at 21,700 and 21,500 come into focus, with 22,000 emerging as a significant hurdle on the upside. The breach of the recent higher bottom at 21,860 suggests a reversal of the bullish pattern, paving the way for potential declines in the near term.


Technical analysis underscores the weakness in the Nifty’s overall chart pattern, signaling a potential resumption of the bearish trend characterized by lower tops and bottoms. Traders and investors should exercise caution amidst any rallies towards the 22,000 level, as they may present selling opportunities in the current market climate.
Options Data and Market Sentiment
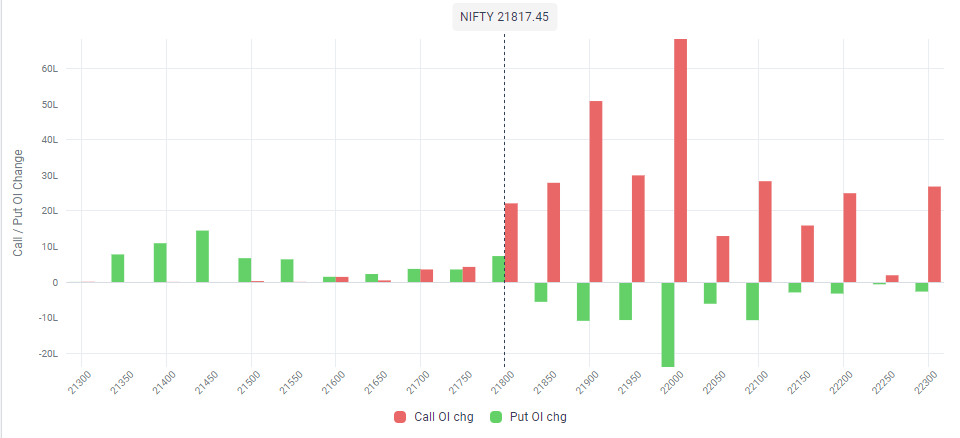
Examining options data provides valuable insights into market sentiment and potential price movements. Immediate support at 21,800 and resistance at 22,000 are significant levels, as reflected in the concentration of Call and Put open interests.
Weekly options data reveals the distribution of open interests across various strike prices, with notable writing observed at key levels such as 21,400 and 21,800. This data serves as a guide for traders in identifying potential price ranges and deciphering market sentiment.


Open Interest Change Graph
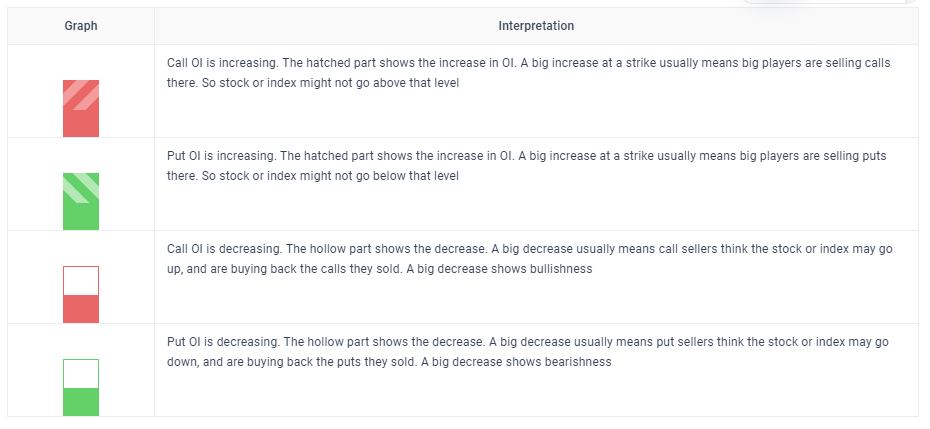
How to read the Open Interest Change Graph?
This chart shows the change in open interest by each strike


Bank Nifty Performance
In tandem with the Nifty 50, the Bank Nifty has also experienced a downtrend, extending for the eighth consecutive session. Despite remaining within the previous day’s trading range, the index formed a small-bodied bearish candlestick pattern, indicating indecision between bulls and bears.
Key levels to monitor in the Bank Nifty include support at 46,000 and resistance at 47,000, where the highest Put and Call open interests are concentrated. A breakout beyond this range is awaited to determine the direction of the next significant move in the index.
Broader Market Trends
Beyond the benchmark indices, broader market indices such as the Nifty Midcap 100 and Smallcap 100 have also faced downward pressure, declining by 1.2 percent each. This broader market weakness underscores the pervasive bearish sentiment across various segments of the market.
In conclusion, the recent bearish momentum in the Nifty 50 and Bank Nifty indices reflects heightened volatility and uncertainty in the market. Traders and investors should remain vigilant and adapt their strategies accordingly to navigate these challenging market conditions effectively.
Daily Market Recap: Nifty and Bank Nifty Performance On March 19, 2024, the Nifty 50 index closed at 21,817.45, marking a decline of 238 points or 1.08% compared to the previous trading day. Similarly, the Bank Nifty closed at 46,384.80, down 191.10 points or 0.41% from the previous day’s close. These movements highlight the volatility inherent in financial markets and underscore the importance of staying informed and adaptable as an investor. By closely monitoring market trends and developments, traders can make more informed decisions and navigate the complexities of today’s economic landscape effectively.
Disclaimer: The views and opinions expressed in this article are those of the author and do not necessarily reflect the official policy or position of any regulatory authority. The author is not a SEBI registered advisor, and readers are advised to conduct their own research and consult with a certified financial advisor before making any investment decisions.
-


 Entertainment1 year ago
Sangeetha Waliketiya: The Rising Star of Sri Lankan Modeling I Photo Gallery 2024
-


 Entertainment1 year ago
Aitana Lopez: Spain’s AI-Generated Influencer Earning ₹3 Lakh Monthly Sparks AI Impact Concerns
-


 OTT1 year ago
‘Oppenheimer’ OTT Release Details, Cast, and Storyline Unveiled! Watch Now on Amazon Prime From November 22
-


 OTT1 year ago
Unlocking Entertainment: Airtel and Jio Prepaid Plans Offering Free Netflix Subscriptions 2023
-


 Finance1 year ago
India’s Economy Surges Beyond $4 Trillion GDP Mark, Poised to Become Fourth Global Economic Powerhouse
-


 Entertainment1 year ago
Salaar: Netflix OTT Release Date Rumors, Box Office Triumph, and Star-Studded Cast {updated}
-


 OTT1 year ago
“Siddharth’s Acclaimed Thriller ‘Chithha’ Set for Digital Premiere on Disney + Hotstar
-


 IPO1 year ago
Exploring Gandhar Oil Refinery’s IPO Launch: Investor Interest, Market Sentiment, and Company Insights


